
Introduction to Gold Nanoparticle Characterization
Background
Gold nanoparticles present distinct optical and physical properties, which are dependent upon their size (diameter), shape, surface structure and agglomeration state. When handling gold nanoparticles, especially when functionalizing their surface with chemical groups or biomolecules, it is often necessary to characterize them, e.g., to evaluate the result of surface modification. This tech note describes some basic techniques for characterizing gold nanoparticles and their modification.
Ultraviolet-Visible (UV-Vis) Spectroscopy
Gold nanoparticles exhibit a distinct optical feature commonly referred to as localized surface plasmon resonance (LSPR), that is, the collective oscillation of electrons in the conduction band of gold nanoparticles in resonance with a specific wavelength of incident light. LSPR of gold nanoparticles results in a strong absorbance band in the visible region (500 nm-600 nm), which can be measured by UV-Vis spectroscopy.
The LSPR spectrum is dependent both on the size (figure 1), and shape (figure 2) of gold nanoparticles. The peak absorbance wavelength increases with particle diameter, and for uneven shaped particles such as gold nanourchins, the absorbance spectrum shifts significantly into the far-red region of the spectrum when compared to a spherical particle of the same diameter.
The peak optical density (OD), or absorbance of the sample, correlates linearly to the concentration of nanoparticles in solution. To correlate the OD value of each size of particles with their concentration (particles/ml), please refer to table 1 below, where an OD value of 1 (with a 1 cm pathlength) applies to nanoparticles between 5 nm and 100 nm.

Figure 1. Gold nanoparticle size dependant surface plasmon resonance. Note the red-shift of the absorption maximum as the gold nanoparticle size increases.

Figure 2. Gold nanoparticle shape dependant localized surface plasmon resonance as indicated by the visual appearance and UV-VIS spectra of spherical (A), and urchin-shaped (B) gold nanoparticles ("spiky gold").
UV-VIS measurements can also be used to evaluate the functionalization of gold nanoparticles. Upon binding of ligands to the gold nanoparticle surface, the LSPR spectrum will red-shift by a few nanometers, as shown in Figure 3. This shift is a result of an increase in the local refractive index at the gold nanoparticle surface, and is the basis of label-free SPR biosensing. For particles with uneven shapes such as gold nanourchins or gold nanorods this local refractive index change is more profound due to a further enhancement of the electromagnetic field at points of "unevenness" at the particle surface.

Figure 3. UV-VIS spectrum of 20nm gold nanoparticles, before (blue) and after (green) conjugation to an antibody. Note the 3nm red-shift of the LSPR peak while maintaing the overall shape and intensity of the spectra indicating successful conjugation of the antibody to the gold surface.
Similarly, aggregation states of gold nanoparticles, i.e., irreversible inter-particle coupling, are also accompanied by a red-shift in the spectrum, as well as broadening of absorption peaks, and a decrease in peak intensities. Aggregation states are also visibly detected by a change in color of the solution from red to blue/purple, as shown in Figure 4. UV-Vis measurements thus provide a simple method to assess the stability of gold nanoparticles, which can be applied to monitor their quality over time as well as evaluating the integrity of the colloidal solution when performing surface modifications. For example, non-functionalized gold nanoparticles aggregate upon the addition of NaCl but when the gold surface is completely shielded by a layer of a conjugated protein, aggregation can be prevented. More details on protein conjugation to gold nanoparticles can be found in Tech Note 102 - Passive Adsorption of Proteins to Gold Nanoparticles or in Tech Note 105 - Covalent Conjugation of Proteins to Carboxyl Gold Nanoparticles.
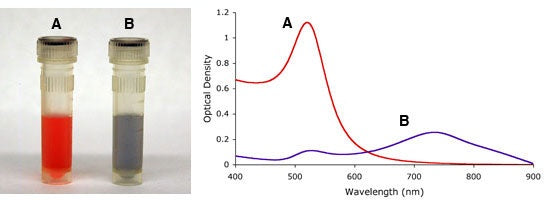
Figure 4. Visual appearance (left) and UV-Vis spectra (right) of monodisperse (A) and sodium chloride (NaCl) induced heavily agglomerated (B) 15nm gold nanoparticles.
Dynamic Light Scattering (DLS)
Dynamic light scattering (DLS) is an analytical technique used for measuring the size and size distribution of submicron-sized particles. In the measurement, a particle suspension is illuminated by a laser beam, and the fluctuation of scattered light is monitored and analyzed, to acquire the velocity of the particles’ Brownian motion and thereby inferring their size.
DLS measures the hydrodynamic size of particles, which includes not only the physical size of the nanoparticle core, but also the surface coating and solvent layer associated with the particle. Therefore, the conjugation of molecules such as PEG, proteins, or oligonucleotides to the gold nanoparticle surface increases their hydrodynamic size. This technique therefore provides another tool to evaluate surface modifications. Figure 5 shows the change of 20 nm gold nanoparticles upon binding of a PEG layer.
Aggregation of gold nanoparticles can also be measured with DLS. While non-aggregated monodispersed gold nanoparticles are measured with DLS as a single size population, aggregation of the particles can present a broadening of the peak, increase in hydrodynamic size, and even multiple populations.
DLS measurement of gold nanoparticles is a very sensitive technique and can be applied not only to measure the size of particles, characterizing surface modification, monitoring the stability of gold nanoparticles over a period of time, but also as a detection approach for bio-assays.

Figure 5. Size histogram obtained by dynamic light scattering measurement of 20 nm gold nanoparticles before (blue) and after (green) surface functionalization with a 3kDa PEG-thiol. The hydrodynamic size increased from 30 nm to 48 nm through the addition of a PEG-layer.
Microscopic Imaging of Gold Nanoparticles
While the limit of resolution of optical microscopy is only sub-micron, electron microscopy, such as Transmission Electron Microscopy (TEM) and Scanning Electron Microscopy (SEM), have a resolution down in the sub-nanometer range. TEM is typically used to determine the physical size and structural morphology of gold nanoparticles. TEM is also a commonly used detection method in immunohistochemistry protocols using gold conjugate detection probes. TEM is also a good technique for studying cellular uptake of gold nanoparticles.
Another important microscopic approach for imaging gold nanoparticles is dark field microscopy. Because of the strong surface plasmon resonance light scattering, gold nanoparticles can be visualized as bright points under a dark field microscope. The color displayed is determined by the peak SPR wavelength. As shown in the dark field microscopy images in Figure 6, spherical gold nanoparticles appear green and gold nanourchins appear red, due to their peak SPR and scattering in the 500 nm and 600 nm range, respectively.

Figure 6. Darkfield microscopy images of silver, gold and gold nanourchin nanoparticles. Note how the wavelength of scattered light changes with nanoparticle composition and nanoparticle shape.
Gel Electrophoresis
Gel electrophoresis is a common analytical technique that separates macromolecules or particles based on their size, shape and charge. It is a powerful tool for analyzing gold nanoparticles and their surface modification. The distinct color of gold nanoparticles and other noble metal nanoparticles enables direct observation of the sample and its migrations within the gel.
Modification of the gold surface with charged ligands or molecules such as amine-PEG, carboxyl-PEG, oligonucleotides or proteins generally results in a change in the surface charge, which can be seen by an altered migration pattern (direction or migration distance) in agarose gel electrophoresis, see Figure 7. Also, surface coating with biomolecules such as proteins increases the size of the nanoparticles, thereby slowing down their electrophoretic speed when compared to unmodified gold nanoparticles.
Gel electrophoresis can thus be effectively used in optimizing the conjugation conditions of molecules onto gold nanoparticles, by revealing the point of saturation beyond which increased loading of molecules causes no further migration shift of the band. Agarose gel electrophoresis can also be used for separation followed by isolation and purification of individual components after functionalization.

Figure 7. Agarose gel analysis of two types of gold nanorods functionalized with either methoxy-PEG-SH or carboxyl-PEG-SH. Note the change in migration pattern between the mPEG and cPEG functionalized samples due to an increased negative charge on the resulting particles. Also, the 700nm absorbing cPEG functionalized gold nanorods migrate faster in the gel than the 650nm cPEG functionalized rods due to their overall smaller size.
Bio-Functionality Testing of Gold Conjugates
Gold nanoparticles are often conjugated with bio-recognition molecules such as antibodies to serve as probes in various bioassays. It is not only important to ensure proper conjugation and stability using aforementioned methods such as UV-Vis measurement, but it is also essential to confirm the functionality of the conjugate, i.e., specific binding of the target analyte.
One simple method to evaluate the functionality of a gold conjugate is through immunoblotting. Briefly, a serial dilution of the analyte to be detected is spotted on a nitrocellulose membrane followed by the addition of the conjugate of interest. If the gold conjugate is functional, binding to the spotted analyte will occur, which is conveniently visualized by a bright red color, see Figure 8. Further amplification of the signal can also be accomplished with silver enhancement.
The presence of a conjugated antibody (or antigen) can also be quickly evaluated using our Conjugation QC Lateral Flow Dipstick Kit.

Figure 8. Binding of 20nm streptavidin labeled gold nanoparticles to a biotinylated antibody spotted on a nitrocellulose membrane before and after silver enhancement.
Table I. Summary of optical and physical properties of Cytodiagnostics spherical standard gold nanoparticles.
